California Coffee Map
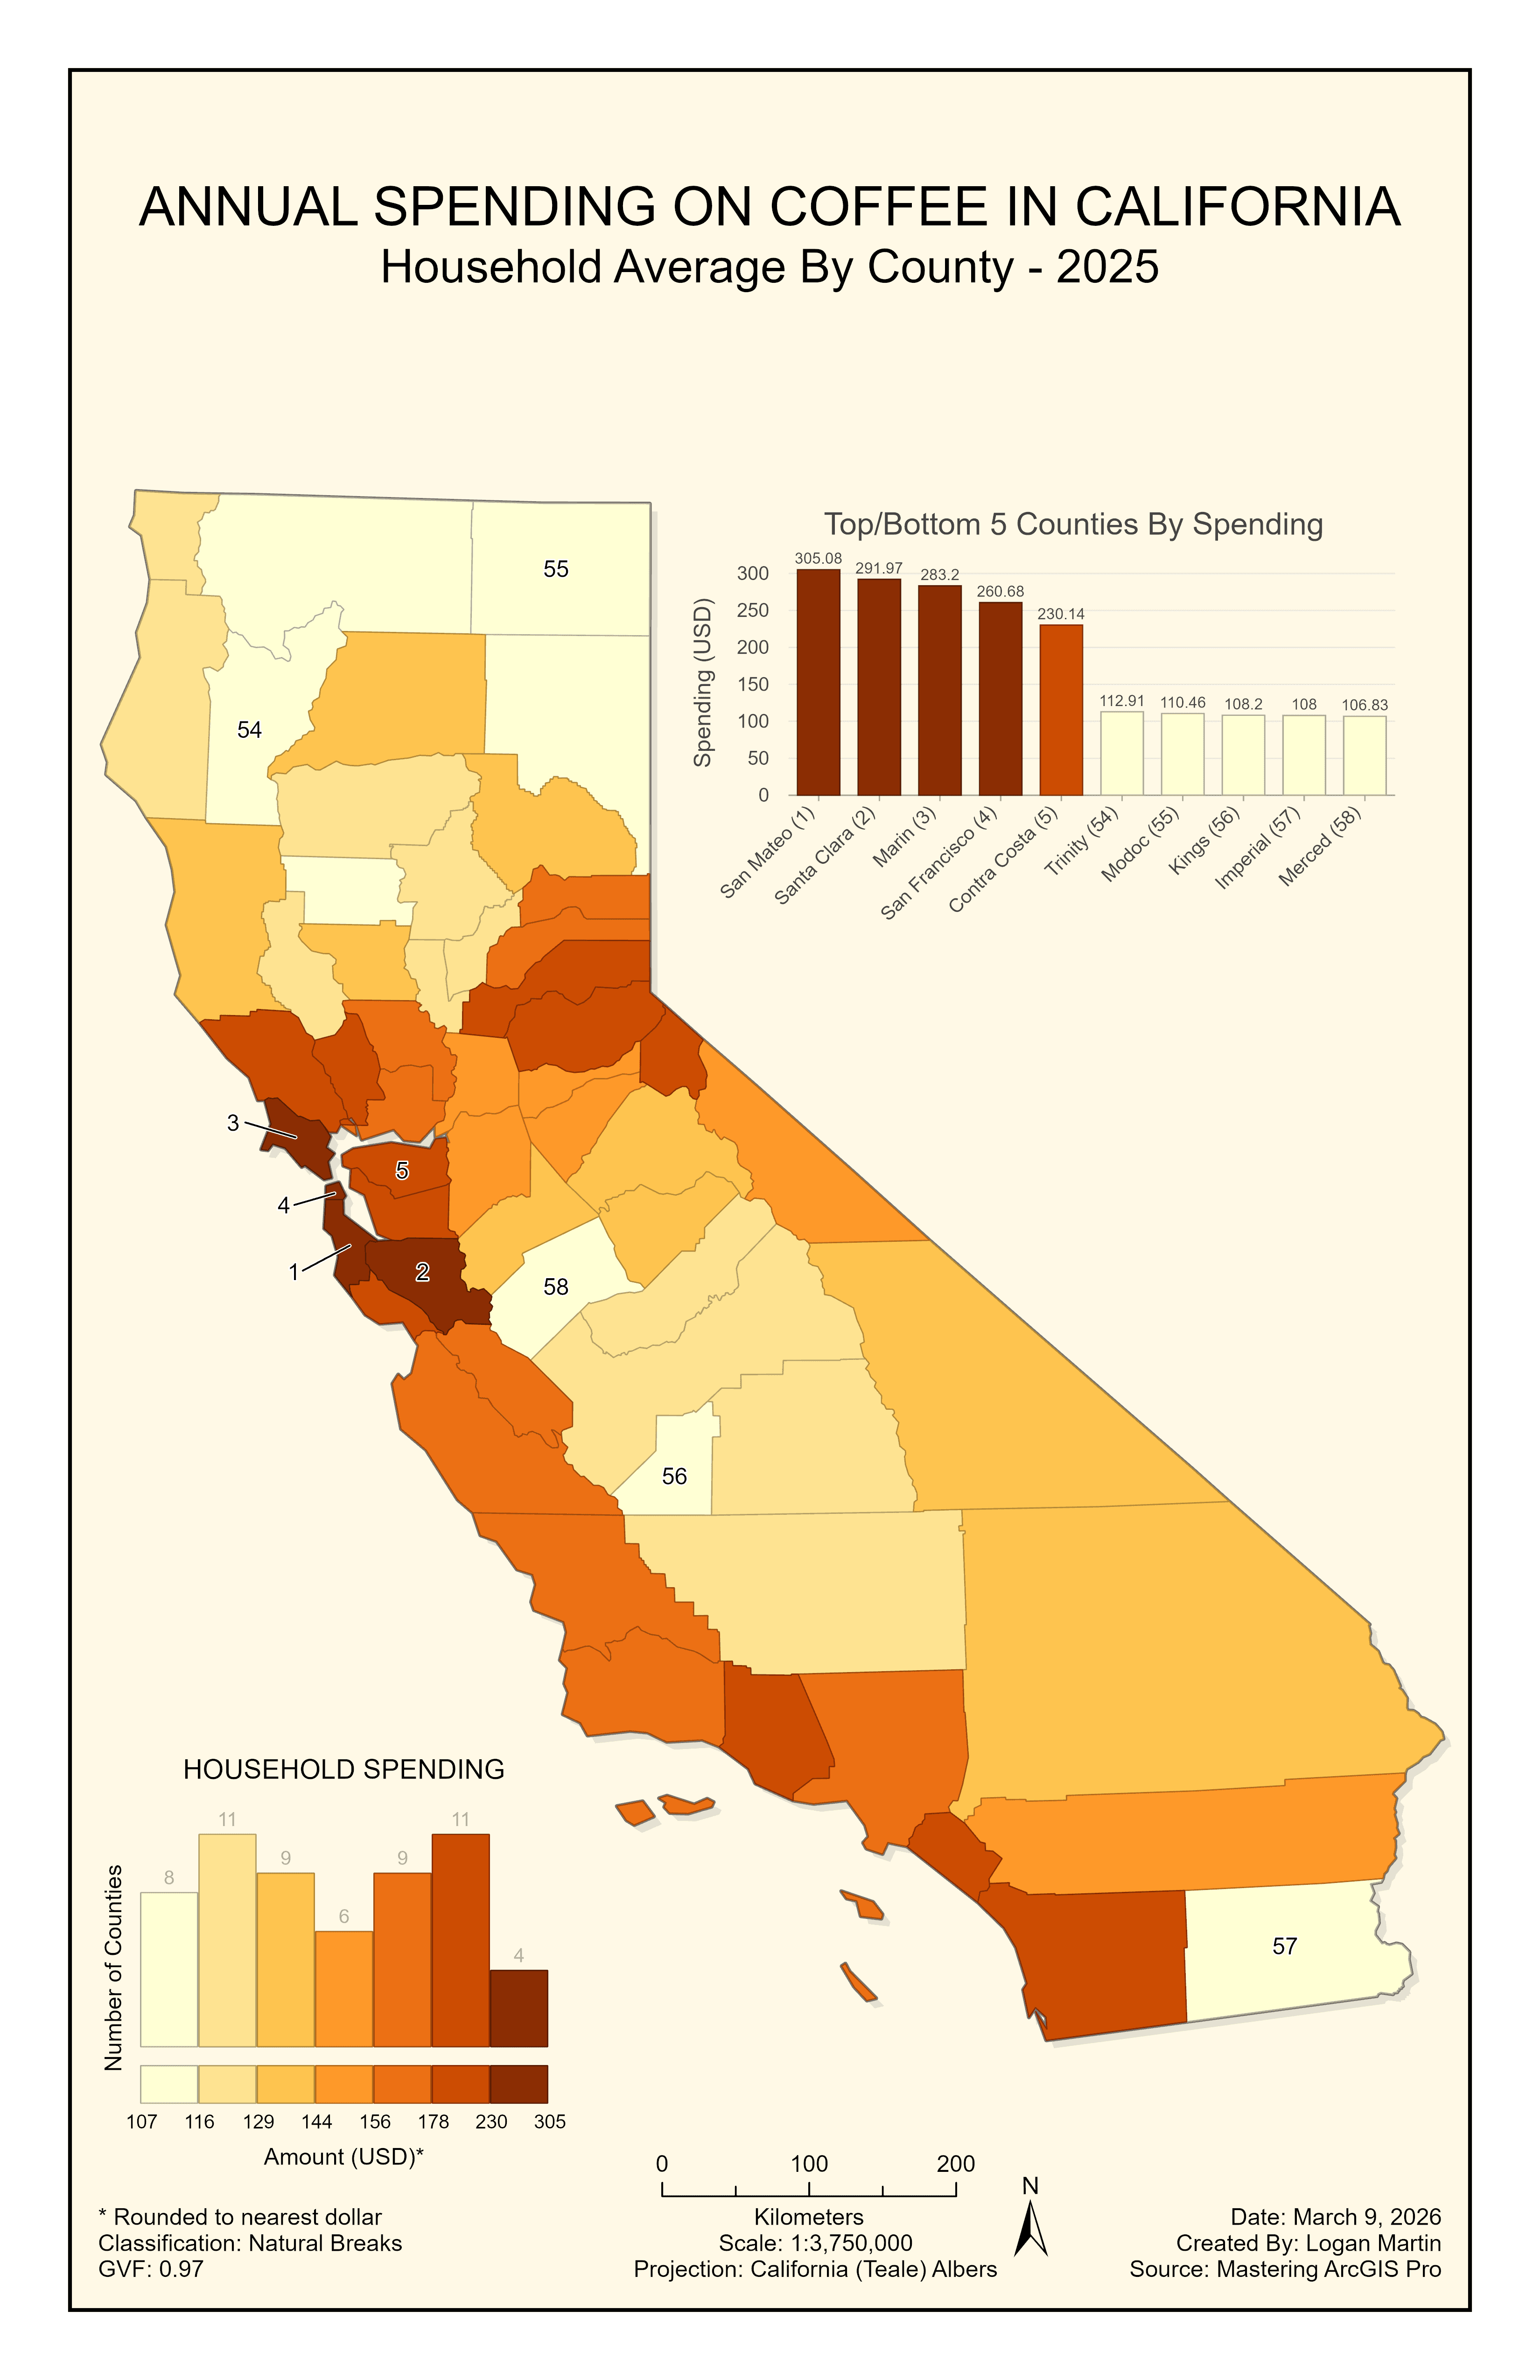
Created a map to show some stats on the annual average spending on coffee in California
Year
2026
Scope
Cartography
A map showing spending on coffee in California
Data
The data was collected using the Enrich tool build into ArcGIS Pro, and is categorized as: Average Household Spending on Coffee. The data represents spending in the year 2025 and was aggregated at the County level.
Map Features
Some of the features of the map layout include:
Histogram Legend
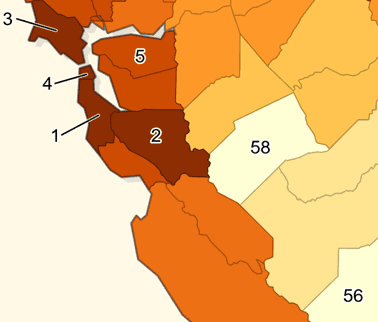
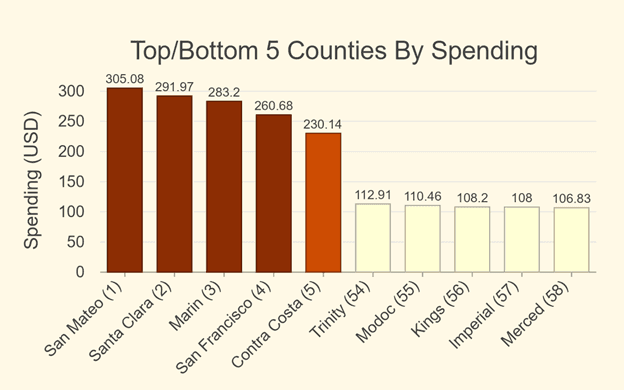
Chart of Top/Bottom 5 Counties w/ corresponding map labels
Calculated GVF for our data classification method (Natural Breaks)